
Tech
How to Use the Stochastic Oscillator in Technical Analysis
Stochastic Oscillator, an indicator developed in the 1950s by George Lane, is a momentum indicator that helps traders anticipate price trend reversals. This technical analysis tool is included in most charting packages and can be easily employed by traders. The stochastic oscillator is known for its ability to detect overbought and oversold levels, signaling to traders that the momentum may be about to stall or reverse direction. This information is used to initiate trades that can potentially generate profits from price movement reversals.
The Stochastic Oscillator is calculated by comparing a specific closing price with a range of high and low prices over a set time period. The standard period is 14 days, but it can be altered by traders to suit their analytical needs. The indicator is comprised of two lines, %K and %D. The %K line compares the closing price of an asset with the lowest and highest low and high prices over the defined period, while the %D line is a moving average of the %K line.
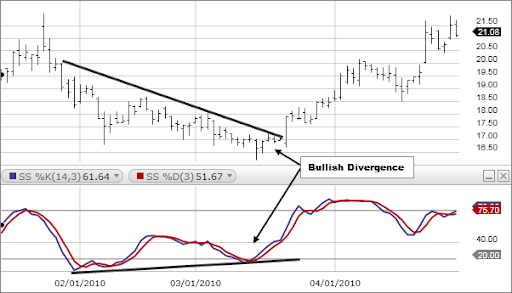
Traders use the indicator by looking for a divergence between the Stochastic Oscillator and a price chart. This can be a bearish setup if the price makes a higher high but the stochastic forms a lower high, and it is a bullish setup if the price makes a lower low but the Stochastic forms a higher low. Stochastic can be used on short-term trading techniques such as scalping and day trading, or it can be combined with longer term trends like trendlines and pivot points to form a complete technical analysis framework.
Although the Stochastic Oscillator is a useful tool, it is important to remember that it does not provide a clear trend direction as an indicator such as a moving average does. Additionally, the indicator can produce false signals when the market is ranging, so it is always important to combine it with other indicators and chart patterns such as Fibonacci retracement cycles and Pitchfork.
The simplest way to use the Stochastic Oscillator is to look for a cross between the %K and %D lines in an overbought or oversold region. Typically, the area above 80 is considered overbought, while the area below 20 is considered oversold. When the %K line starts to decrease and crosses below the %D line in the overbought area, it is a sell signal. The opposite is true for a buy signal, which occurs when the %K line starts to increase and crosses above the %D line in the oversold area.


Austin Butler Net Worth, Early Life, Career, Personal Life (2023)

Chevy Chase Net Worth, Early Life, Career, Personal Life (2023)

Jack Antonoff Fiance: Know Details About Margaret Qualley!

Dave Coulier Net Worth 2023: Uncle Gladstone Is Worth $5 Million!!

Jason Alexander Net Worth In 2023: Know How He Earned $50 Million!

Know How Jada Pinkett Smith Net Worth Became A Massive $50 Million!


Jack Antonoff Fiance: Know Details About Margaret Qualley!

Janet Jackson Net Worth 2023: The Rhythm Nation Star owns $180M!

Halle Bailey Movies And TV Shows: A New Star Is Rising!

Melanie Griffith Net Worth 2023: The Working Girl owns $40 million!

Christie Brinkley Net Worth In 2023: She Has $100 Million In Bank!

Shannen Doherty Net Worth In 2023: Know The Details Here!


Kellie Pickler Net Worth, Early Life, Career, Personal Life (2023)

Who Are Nepo-Kid Gracie Abrams Parents? Know It All Here!
Jack Antonoff Fiance: Know Details About Margaret Qualley!
Janet Jackson Net Worth 2023: The Rhythm Nation Star owns $180M!
Christie Brinkley Net Worth In 2023: She Has $100 Million In Bank!

Brad Paisley Net Worth In 2023: Know How He Makes His Millions!


Jason Alexander Net Worth In 2023: Know How He Earned $50 Million!
Know How Jada Pinkett Smith Net Worth Became A Massive $50 Million!

Roseanne Barr Net Worth: Know About The Ever-Controversial TV Persona!

Know The Latest Scoop About Finn Wolfhard Girlfriend – Elsie Pearls Richter!

Gigi Hadid Net Worth and a Few Facts To Know About her!

Kendall Jenner Net Worth and ten Facts less Known About her.


How are The Nutrition Levels Affected By Canning?

The Top Tips for Decorating for a Wedding

Robert De Niro Net worth and the best of facts concerning him!

Tom Hanks Net Worth and Five Facts that are Fascinating

Chris Evans Net Worth and 8 Facts Less Known About Him.

Dr. Dre Net Worth 2021 & facts lesser-known of hip-hop artist

How Viva Money Is Redefining Credit Access for the Next Generation?

Promoting Health Apps Through Smart Content Marketing: The Unimeal Case

Mastering RV Starlink Installation for Reliable Internet on the Go

PPF Orlando: The Smartest Way to Protect Your Car from Florida Roads
